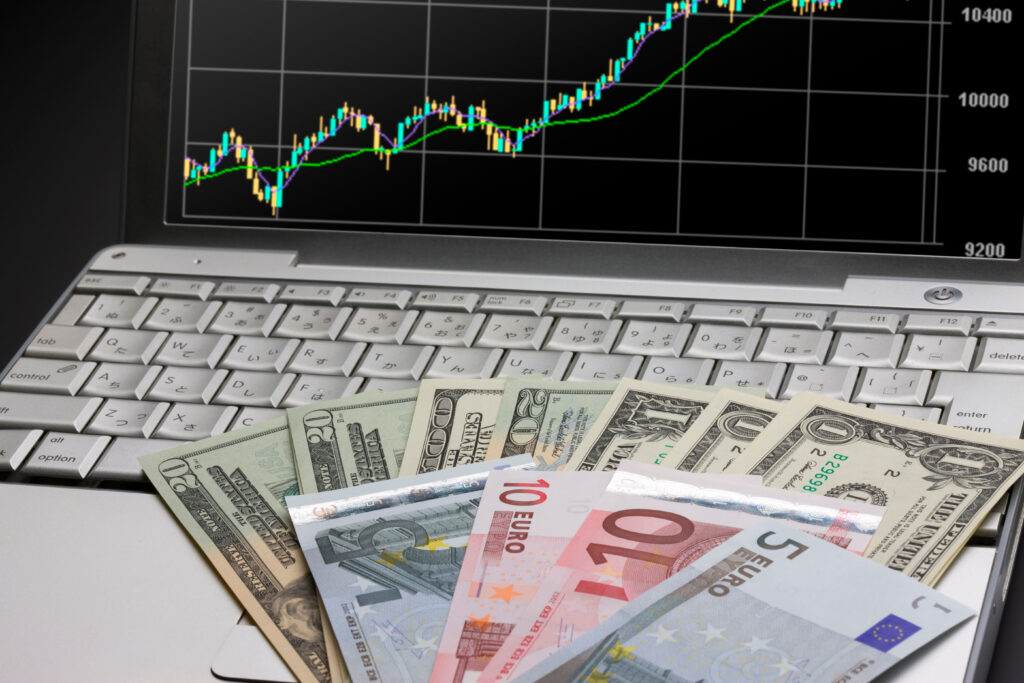
There are numerous technical indicators available for intraday trading, and the effectiveness of each indicator can vary depending on the trading strategy and market conditions. Here are ten popular technical indicators used by intraday traders:
- Moving Average (MA): Moving averages help identify trends by smoothing out price data over a specific period. Common ones include the 50-day and 200-day moving averages.
- Relative Strength Index (RSI): RSI measures the speed and change of price movements, indicating overbought or oversold conditions. It ranges from 0 to 100, with values above 70 suggesting overbought and below 30 suggesting oversold.
- Stochastic Oscillator: The stochastic oscillator compares a security’s closing price to its price range over a specific period. It also indicates overbought or oversold conditions, similar to RSI.
- Bollinger Bands: Bollinger Bands consist of a moving average and two standard deviation lines. They help identify volatility and potential price breakouts when the price moves near the upper or lower band.
- MACD (Moving Average Convergence Divergence): MACD is a trend-following momentum indicator that shows the relationship between two moving averages. It identifies bullish or bearish crossovers and provides signals for potential trend reversals.
- Volume Weighted Average Price (VWAP): VWAP calculates the average price weighted by trading volume throughout the trading day. It is commonly used to identify the fair value of an asset and potential reversal or breakout points.
- Average True Range (ATR): ATR measures market volatility by calculating the average range between a series of high and low prices. It helps set stop-loss levels and determines position size based on market volatility.
- Fibonacci Retracement: Fibonacci retracement levels help identify potential support and resistance levels based on the Fibonacci sequence. Traders use these levels to find potential entry and exit points.
- Ichimoku Cloud: The Ichimoku Cloud indicator combines various elements to provide a comprehensive view of price momentum, support/resistance levels, and trend direction. It helps identify potential signals for buying or selling.
- Parabolic SAR: Parabolic SAR is a trend-following indicator that provides potential entry and exit points. It appears as dots above or below the price chart and flips when the trend reverses.
Remember that no single indicator guarantees profitable trades. It’s essential to understand each indicator’s strengths and weaknesses and use them in conjunction with other analysis tools and risk management strategies. Additionally, consider backtesting and practicing with these indicators before using them in live trading.

